Social Determinants of Health in Western North Carolina

What are Social Determinants of Health ?

Social determinants of health are “conditions in the places where people are born, grow, live, work, and age” (CDC, 2022). These circumstances are shaped by a distribution of money, power, and resources, at global, national, and local levels. Social determinants of health are largely responsible for health inequities- the unfair and avoidable differences in health status seen within and between countries (McCartney et. al., 2019). Some environmental conditions enhance quality of life and positively influence population health outcomes. These conditions include safe housing, adequate transportation, education/literacy programs, job opportunities, access to nutritious foods/clean water, and physical activity (Healthy People 2030, 2022).

For more information on health inequities please see the health inequities page linked.

Why are the Social Determinants of Health Important?

In the United States clinical care impacts only 20% of county-level variation in health outcomes, while social determinants of health affect as much as 50% of health outcomes. More specifically socioeconomic factors alone may account for 47% of health outcomes (Assistant Secretary for Planning and Evaluation, 2022) The number of deaths that can be linked to poverty, racism, and other social factors is comparable to leading causes of death in the US, such as heart attacks, stroke, and lung cancer (Galea et al., 2011). The North Carolina Department of Health and Human Services, in collaboration with stakeholders, identified four priority domains of Social Determinants of Health which include food insecurity, housing instability, transportation challenges, interpersonal violence, and toxic stress (NC DHHS, 2018). These conditions not only have a deep impact on a person’s health, safety, and well-being but also on healthcare utilization and costs.

The North Carolina Department of Health and Human Services’ State Center of Health Statistics has created an interactive map with a series of overlays showing social determinants of health indicators in North Carolina, including the economic, social, neighborhood, and housing transportation status of residents across the state.

(NC DHHS, 2018)

Poverty

Between 2016 and 2020, 13.3% of the population in WNC was below the poverty level.

(WNCHN- WNC Healthy Impact Community Health Survey, 2021)

Percent Total Population Below 100% Poverty Level, 2014-2018

Source: ACS, 2020

Explore the regional WNC Data Set to review local and regional poverty data in more depth.

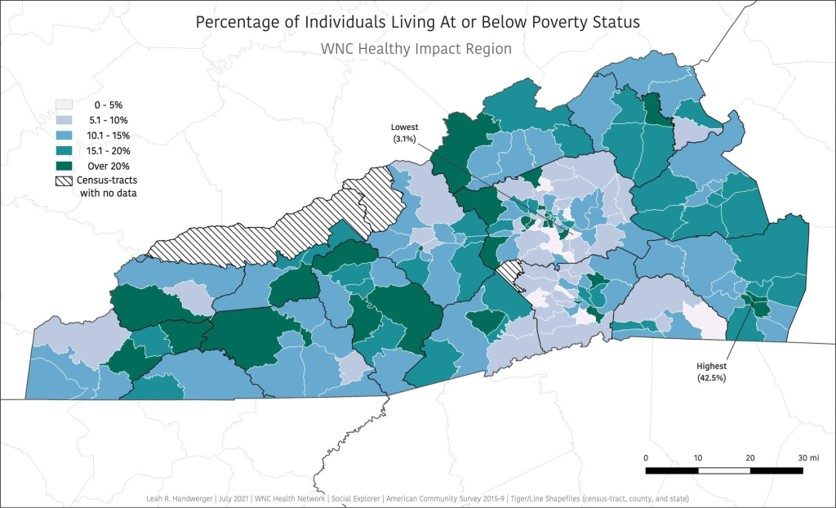
Percent of Individuals Living At or Below Poverty Status, 2015-2019

Source: American Community Survey, 2015-2019

What do the Numbers Say about Poverty?

Approximately 13% of adults in WNC fall under the poverty level. The adult populations most affected by poverty include:

  • Those identifying as Black (18.9%), Hispanic (28.2%), or American Indian/Alaska Native, Indigenous (13.3%)

(WNCHN- WNC Healthy Impact Community Health Survey, 2021)

Differences in health outcomes across social groups, economic status, and racial/ethnic identity are closely linked with disparities in Social Determinants of Health which disproportionately burden individuals and communities who experience systemic disadvantage and/or discrimination.

State and National Findings:

As of 2020, there were more women (12.9%) living in poverty when compared to men (10.6%).

(Poverty USA, 2020)

The official poverty rate in 2021 was 11.6%, with $37.9 million people in poverty.

(United States Census Bureau, 2022)

Food Insecurity

More than half of very low-income adults in WNC have experienced food insecurity in the past year.

(WNCHN – WNC Healthy Impact Community Health Survey, 2021)

Food Insecure per County, by Year

Source: WNC Healthy Impact Community Health Survey, 2018-2021

Food Insecure represents those who responded “often true or sometimes true” to either:

1) worried about whether our food would run out before we got money to buy more.

2) The food we bought just did not last and we did not have enough money to get more.

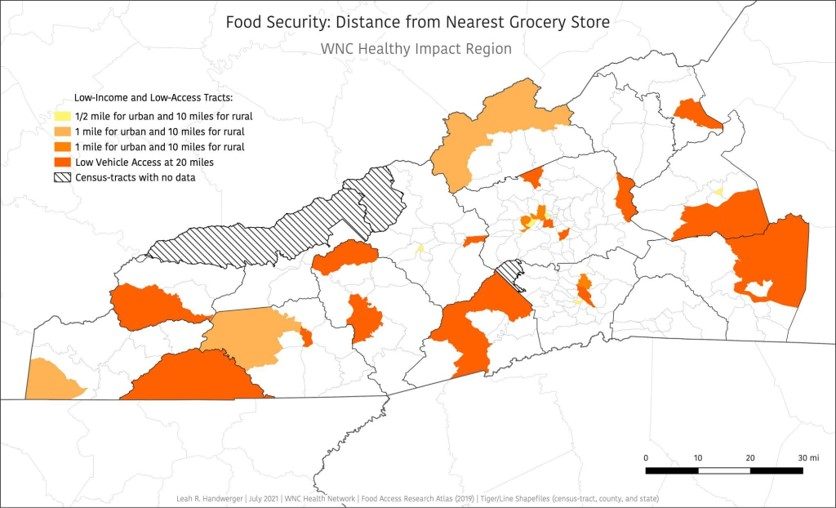
Food Insecurity: Distance from the Nearest Grocery Store, 2015-2019

Source: American Community Survey, 2015-2019

What do the Numbers Say about Food Insecurity?

Approximately 20% of adults are food insecure in WNC. The following adult populations were significantly more likely to be food insecure in 2021:

  • Women (24.9%)
  • Adults aged 18-39 (26.3%)
  • Very low (54.6%) and low income (31.7%)
  • Those identifying as either Black (29.6%), Hispanic (35.7%), or American Indian/Alaska Native, Indigenous (57.8%)

(WNCHN- WNC Healthy Impact Community Health Survey, 2021)

In 2020, 14.8%of households with children were food-insecure, up from 13.9% in 2019. In 2020, the households most commonly experiencing food insecurity were:

  • Married couples with children (4.6%)
  • Hispanic households with children (12.2%)

(USDA- Economic Research Service, 2022)

Differences in health outcomes across social groups, economic status, and racial/ethnic identity are closely linked with disparities in Social Determinants of Health, which disproportionately burden individuals and communities who experience systemic disadvantage and/or discrimination.

State and National Findings: 

In 2021, roughly 32% (32.1)of households with income below the federal poverty line were food insecure.

(USDA, 2022)

Rates of food insecurity in the United States were higher than the national average for single-parent households, as well as, for Black and Hispanic households. Food insecurities were also more common among large cities and rural areas when compared to suburban areas. 

(USDA, 2022)

In 2020, 85.2% of households with children were food secure, while 14.8% were food-insecure, up from 13.9% in 2019.

(USDA, 2022)

Since March of 2020, food insecurities in families with children in the United States have risen by nearly two-thirds.

(Save the Children, 2021)

Housing Instability

Between 2016-2020, 41.9% of Western North Carolina’s population that rent housing were paying over 30% of their monthly income toward housing.

(WNCHN – WNC Healthy Impact Community Health Survey, 2021)

Adults with Housing Rent Greater than 30%, by Year

Source: ACS, 2020

Thirty percent of household income is a widely used and accepted standard to measure the extent of housing affordability problems across the country.

(Joint Center for Housing Studies of Harvard University, 2018)

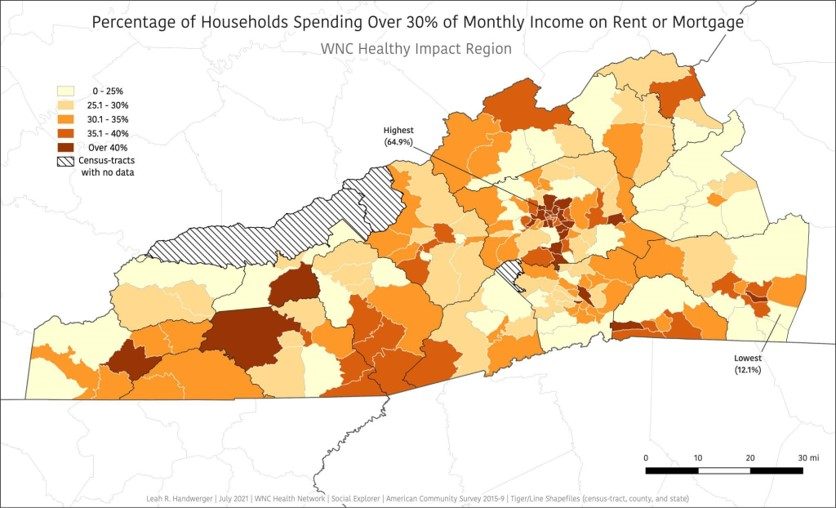
Percent of Households Spending Over 30% of Monthly Income on Rent or Mortgage, 2015-2019

Source: American Community Survey, 2015-2019

In 2021, 26.7% of WNC reported being worried or stressed about paying rent or a mortgage within the past year.

(WNCHN – WNC Healthy Impact Community Health Survey, 2021)

State and National Findings:

As of May 2022, the median listed rent for an available apartment rose above $2,000 a month.

(Redfin News, 2022)

As of January 2021, there were an estimated 15 million adults in the United States facing housing insecurity.

(American Progress, 2022)

Mapping Housing Affordability in North Carolina

The North Carolina Housing Coalition has developed a mapping tool in partnership with the North Carolina State University Geospatial Information Science and Technology Program. This tool explores different aspects of the housing affordability challenge faced by each county.

(North Carolina Housing Coalition, 2019)

Explore the 2023 County Profiles for additional county-level housing data, including: a comparison of what different jobs pay and changes in home prices, foreclosures, and rental options in communities.

Transportation Challenges

As of May 2020, more than one million rural households did not have access to a car. On a national level, the majority of households without a car are in Urban areas with about 9% of households in urban counties not having access to a car.

(Smart Growth America, 2020)

In 2019, roughly 3% of households in Western North Carolina were without a vehicle.

(WNCHN – WNC Healthy Impact Community Health Survey, 2021)

Households Without a Vehicle, 2015-2019

Source: ACS, 2021

“Because transportation touches many aspects of a person’s life, adequate and reliable transportation services are fundamental to healthy communities.”

(American Hospital Association, 2017)

State and National Findings:

In 2019, 5% of the United States workforce relied on public transportation to get to work. 

(Health Affairs, 2021)

In 2021, 5.5% of North Carolina households did not have a vehicle, while 8.3% of United States households were without a vehicle. 

(U.S. Census Bureau, 2021)

Interpersonal Violence and Toxic Stress

Interpersonal violence refers to violence between individuals, and is subdivided into family, intimate partner violence, and community violence.

Family and intimate partner violence “includes child maltreatment, intimate partner violence; and elder abuse, while [community violence] is broken down into acquaintance and stranger violence which includes youth violence; assault by strangers; violence related to property crimes; and violence in workplaces and other institutions” (World Health Organization, 2024).

In the 2020-2021 fiscal year there were over 17,000 (17,746 total) crisis calls in Western North Carolina.

(North Carolina Department of Administration, 2020)

Number of Crisis Calls, by Fiscal Year

Source: North Carolina Department of Administration, 2020-2021

The NC Council for Women and Youth Involvement (NCCFWYI) requires each state-funded domestic violence (DV) grantee to report semi-annually on client service provision. The above chart represents the number of crisis calls made to state-funded domestic violence agencies in WNC per fiscal year.

State and National Findings:

In WNC, there were 3,586 fewer crisis calls and 709 fewer clients served from fiscal year 2018 to 2019.

(North Carolina Department of Administration, 2020)

Sexual assault is often under-reported. Approximately, 230 out of every 1,000 sexual assaults are reported to the police, meaning about 3 out of 4 go unreported.

(Department of Justice – National Crime Victimization Survey, 2017)

What’s the Regional Story Behind Social Determinants of Health?

The items below are paraphrased themes that emerged from a 2021 regional survey of key informants. These responses do not:

  • Reflect accurate or scientifically validated information about health determinants, outcomes, and/or strategies for change,
  • Represent an exhaustive list of factors that can help or hurt efforts to address this key regional health issue.

(WNCHN – Online Key Informant Survey, 2021)

The information in this section should be interpreted and used with care. It should be used only to help local health departments and agencies begin to understand community perceptions about local health issues. Communities are strongly encouraged to collect their own, local-level data to inform local planning and evaluation activities.
What’s Helping?

  • Collaboration between community partners
  • Foodbanks/assistance programs
  • Community/family assistance
  • Awareness/education
  • Job training for employment assistance

What’s Hurting?

  • Inflation
  • Transportation
  • Not enough support from the community
  • Stigma/Pride
  • Lack of higher paying jobs

What are we hearing?

“Many groups are working on a common goal of reducing youth substance use, adult substance misuse, food insecurity and issues related to poverty.”

“Affordable, safe and healthy housing creates an environment that is the foundation for much of one’s life. It impacts rest, work and health. Having access to this type of housing can reduce stress, allow for appropriate study for students, foster healthy family relationships and community relationships.”

“Affordable, safe and healthy housing creates an environment that is the foundation for much of one’s life. It impacts rest, work and health. Having access to this type of housing can reduce stress, allow for appropriate study for students, foster healthy family relationships and community relationships.”

“There are many technical service providers offering free assistance to both jobseekers and would-be entrepreneurs.  There are programs to help people move from unemployment to employment.”

“Public transportation provides access to medical appointments, as well as meals at the senior center, transportation to employment, grocery shopping, etc.”

How is the region prioritizing social determinants of health?

The Western North Carolina region includes 17 communities: 16 counties and Eastern Band of Cherokee Indians (EBCI)

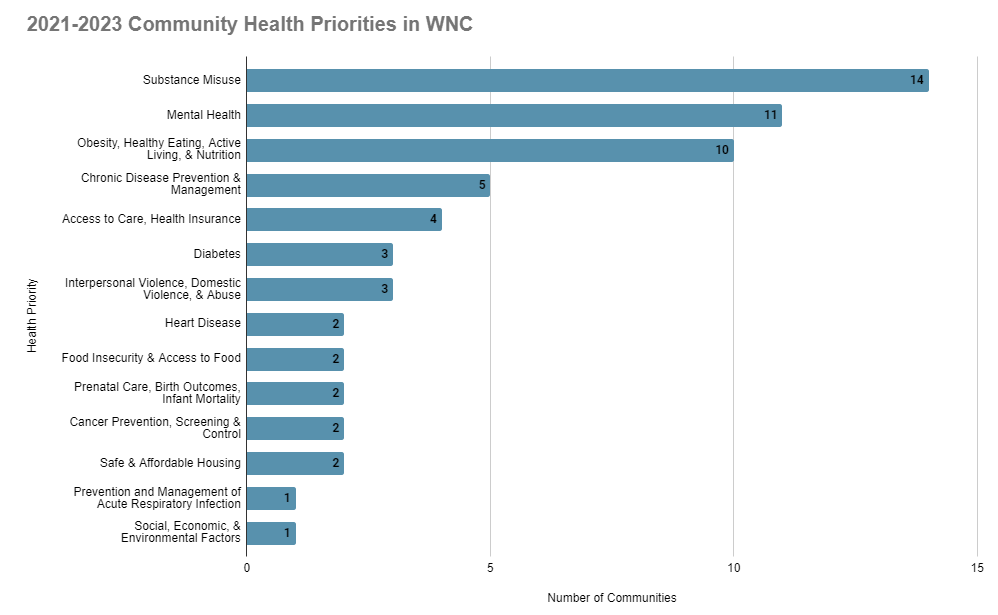
In the 2021 CHA cycle, one community selected social determinants of health as a key priority.

However, all WNC communities consider the social determinants of health as key drivers to addressing local key health priorities.