Income affects health through numerous pathways, including the ability to purchase health care, quality of nutrition and housing(1) level of education attainment, and employment status(2). These factors then act together to influence health outcomes. Our analysis shows a disproportionate burden of ‘poor health’ occurred among individuals in the lowest-income category even after adjusting for important sociodemographic factors.
- Adler NE, Newman K. Socioeconomic disparities in health: Pathways and policies. Health Aff. 2002;21(2):60-76. doi:10.1377/hlthaff.21.2.60
- Office of Disease Prevention and Health Promotion. Poverty | Healthy People 2020. https://www.healthypeople.gov/2020/topics-objectives/topic/social-determinants-health/interventions-resources/poverty. Published 2020. Accessed December 1, 2020.
For more information on income in WNC, see Social Determinants of Health Data Story.
![]()
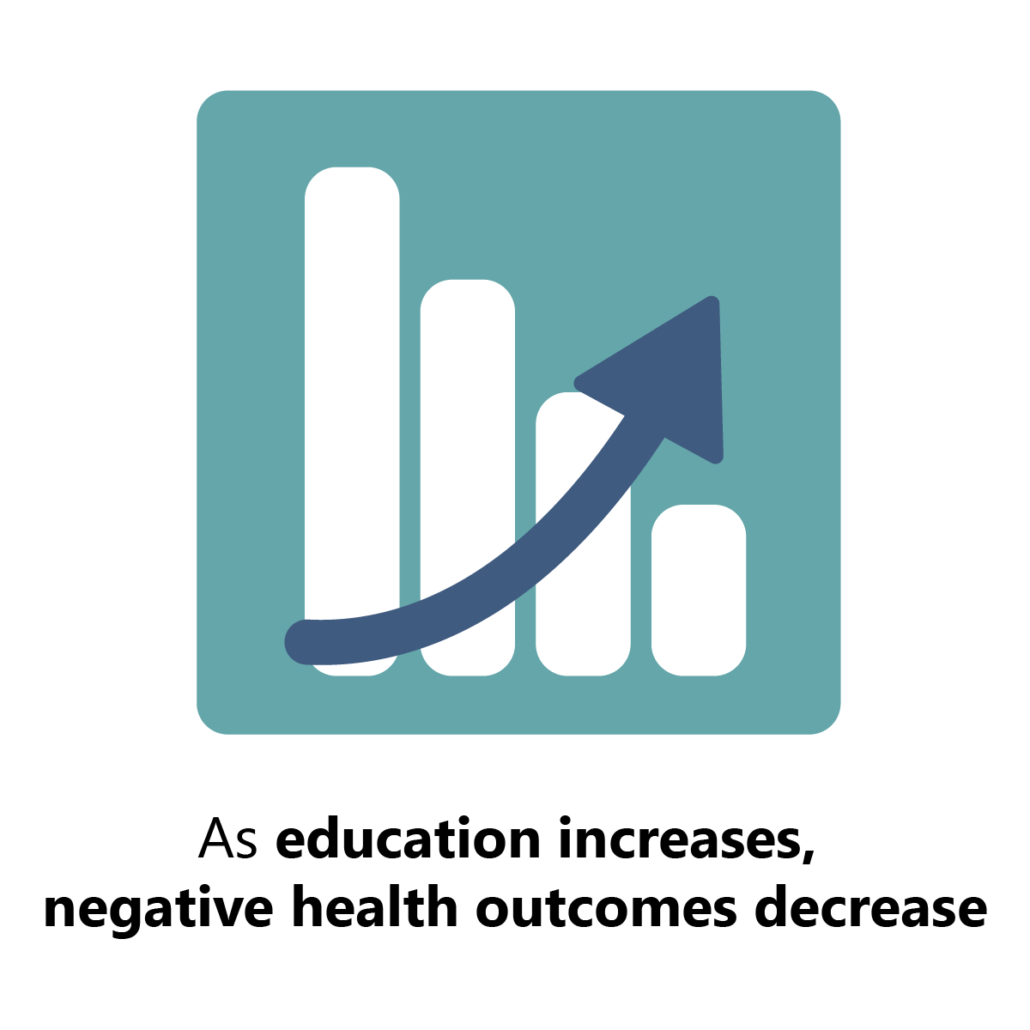
Low education levels are often linked to higher risk of chronic conditions; this effect decreases as one attains higher levels of education. However, the findings in this data analysis show that this is not always consistent across each increase in education level and for each correlated health condition(1). It should be recognized that poor health affects everyone and that education is helpful, but it is not always equally protective or equally accessible to everyone. Finally, it is important to note that education affects health in combination with other factors like income and employment status (2)(3).
- Office of Disease Prevention and Health Promotion. Poverty | Healthy People 2020. https://www.healthypeople.gov/2020/topics-objectives/topic/social-determinants-health/interventions-resources/poverty. Published 2020. Accessed December 1, 2020.
- National Center for Chronic Disease Prevention and Health Promotion. Health Equity. https://www.cdc.gov/chronicdisease/healthequity/index.htm. Accessed December 1, 2020.
- Feinstein L, Sabates R, Anderson TM, Sorhaindo A, Hammond C. Measuring the Effects of Education on Health and Civic Engagement – OECD. In: Proceedings of the Copenhagen Symposium. ; 2006:173.
Diabetes
Compared to college graduates:
- People with ‘some high school’ are 2 times more likely to have diabetes
- People with a ‘high school’ degree are 41% more likely to have diabetes
- People with ‘some college’ are 47% more likely to have diabetes
- People with a ‘postgraduate degree’ are 34% less likely to have diabetes
Heart Disease
Compared to college graduates:
- People with ‘some high school’ are 2.2 times more likely to have heart disease
Obesity
Compared to college graduates:
- People with a ‘high school’ degree were 28% more likely to be obese
- People with ‘some college’ were 27% more likely to be obese
- People with a ‘postgraduate degree’ are 30% less likely to be obese
(WNCHN, 2023)
High Blood Pressure and High Cholesterol
Compared to college graduates:
- People with a ‘high school’ degree were 2 times more likely to experience high blood pressure
- People with ‘some college’ were 82% more likely to experience high cholesterol
- People with ‘some college’ were 26% more likely to experience high blood pressure
Poor Physical Health and Limited by Impairment
Compared to college graduates:
- People with ‘some high school’ are 77% more likely to report poor physical health
- People with a ‘high school’ degree are 2.1 times more likely to report poor physical health
- People with ‘some college’ are 3.2 times more likely to report poor physical health
- People with ‘some college’ are 55% more likely to be limited by impairment
COPD
Compared to college graduates:
- People with ‘some high school’ are 64% more likely to have COPD
- People with a ‘high school’ degree are 59% more likely to have COPD
- People with ‘some college’ are 2.3 times more likely to have COPD
(WNCHN, 2023)

Percent of the Population Graduating High School by County, 2016-2020
Source: US Census Bureau, 2022
Research shows that unemployment can negatively affect both mental and physical health, as well as contribute to increased reports of depression, anxiety, low self-esteem, high blood pressure, increased risk of stroke, heart attack, heart disease, and arthritis(1). The data analysis reflects this relationship between unemployment and poor mental and physical health.
- Office of Disease Prevention and Health Promotion. Employment | Healthy People 2020. https://www.healthypeople.gov/2020/topics-objectives/topic/social-determinants-health/interventions-resources/employment. Published 2020. Accessed December 1, 2020.
Compared to people with jobs, people who self-reported that they were unable to work were:
- 3.9 times more likely to have diabetes
- 3.5 times more likely to report poor mental health
- 2.8 times more likely to have COPD
- 2.6 times more likely to have asthma
- 2.4 times more likely to experience a fall
- 2.1 times more likely to experience high blood pressure
- 2.1 times more likely to have prediabetes
- 88% more likely to experience high cholesterol
- 77% more likely to have obesity
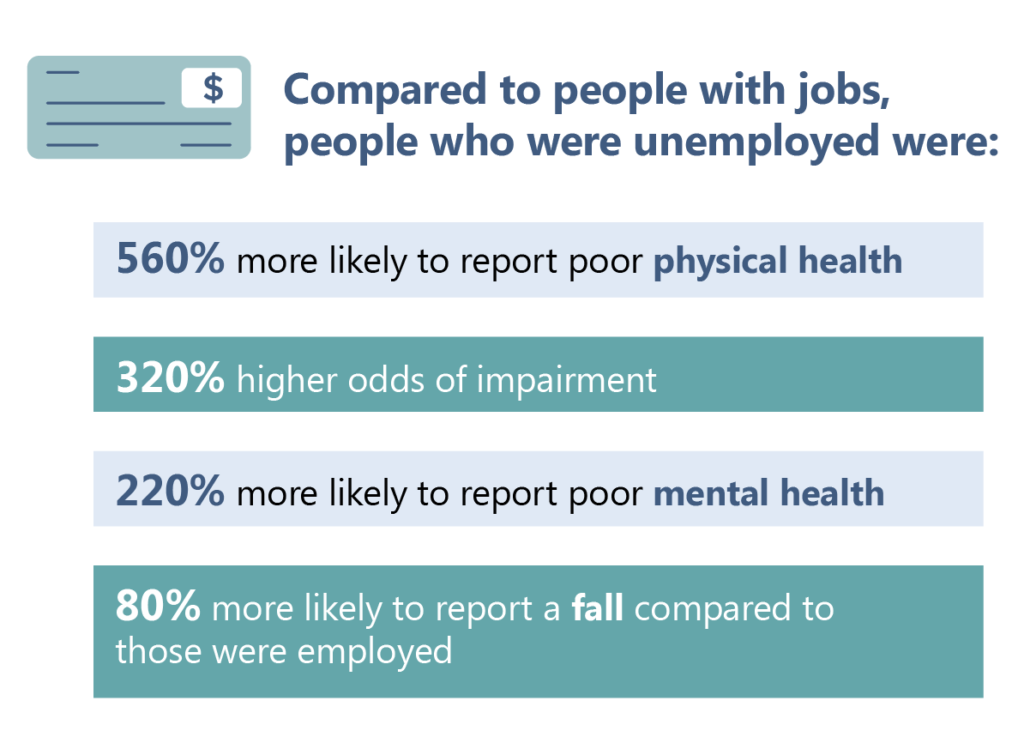
Compared to people with jobs, people who were unemployed were:
- 5.6 times more likely to report poor physical health
- 3.2 times more likely to be limited by impairment
- 2.2 times more likely to report poor mental health
- 80% more likely to report a fall
(WNCHN, 2023)
Unemployment Totals by County, 2021
Source: US Census Bureau, 2022
Having health insurance helps to offset the overall cost of health care, making it more affordable for the consumer(1). Not having health insurance means that an individual is less likely to receive preventive care and screening services, less likely to receive appropriate care to manage a chronic health condition, and more likely to die prematurely than an individual that does have health insurance coverage(1).
- Institute of Medicine (US) Committee on the Consequences of Uninsurance. Effects of Health Insurance on Health. In: Care Without Coverage: Too Little, Too Late. National Academies Press (US); 2002. https://www.ncbi.nlm.nih.gov/books/NBK220636/. Accessed December 1, 2020.

Compared to people with insurance, people who were uninsured were:
- 2.2 times more likely to have diabetes
- 2.1 times more likely to have prediabetes
- 84% more likely to experience high cholesterol
- 64% more likely to be limited by impairment
- 31% more likely to experience high blood pressure
- 25% less likely to report a fall
Percent of Adults Lacking Health Insurance per County, by Year
Source: WNC Healthy Impact Community Health Survey, 2012-2021
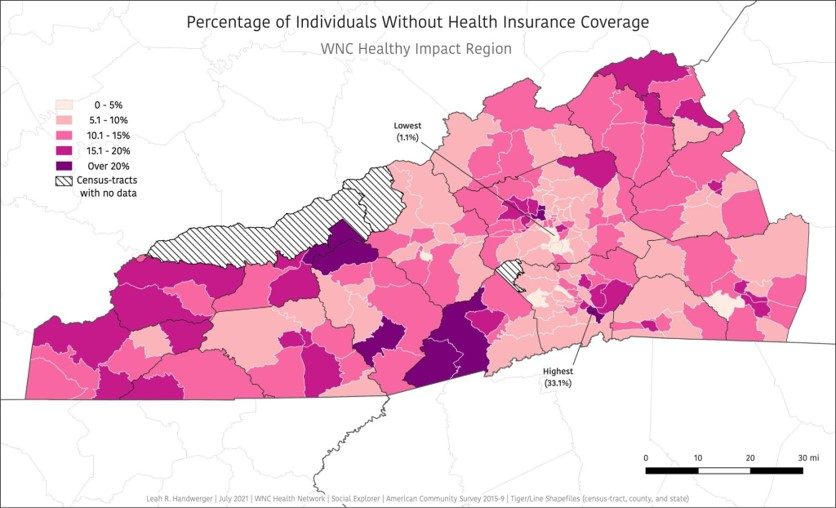
Percent of Individuals Without Health Insurance Coverage, 2015-2019
Source: American Community Survey, 2015-2019
Rural versus Urban
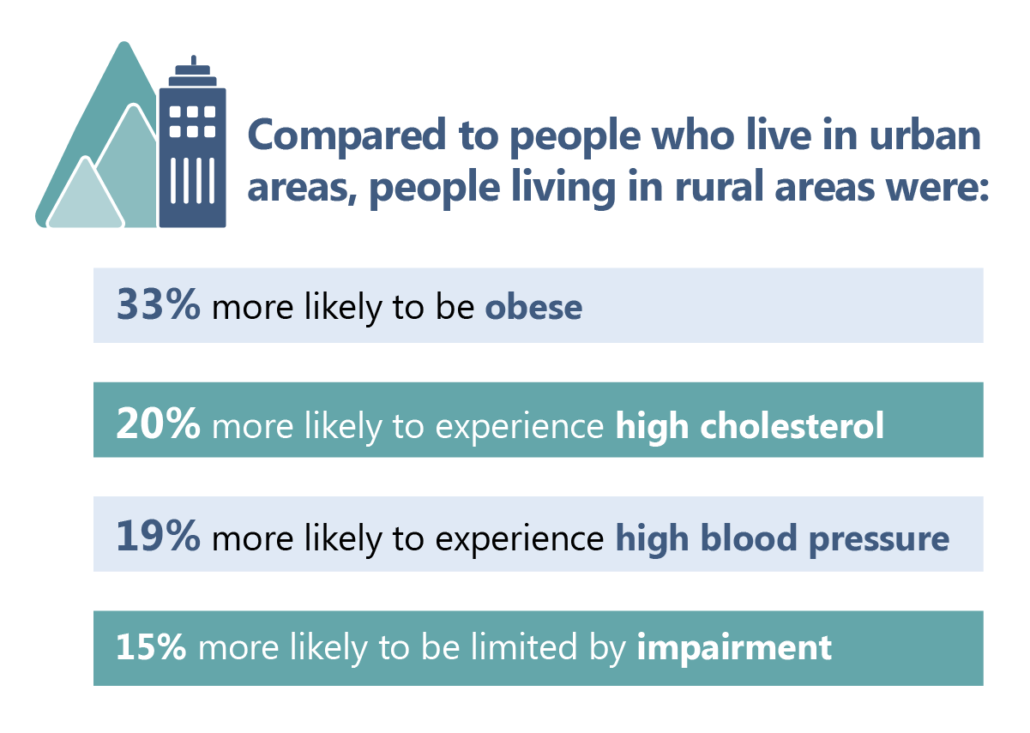
Rural areas tend to have a smaller health care workforce with fewer providers to see and treat patients. In addition, people living in rural areas tend to be poorer, have greater distances to travel to providers(1), and are less likely to have health insurance(2). Factors such as these lead to higher rates of heart disease, unintentional injury, and obesity in rural populations than urban populations(1-3); this is reflected in our data analysis.
- National Rural Health Association. About Rural Health Care. https://www.ruralhealthweb.org/about-nrha/about-rural-health-care. Published 2020. Accessed December 2, 2020.
- Warshaw R. Health Disparities Affect Millions in Rural U.S. Communities. Association of American Medical Colleges News.
- Centers for Disease Control and Prevention. About Rural Health. https://www.cdc.gov/ruralhealth/about.html. Published 2017. Accessed December 1, 2020.
On a biological level, humans are extremely similar(1); yet, some populations (for example, Black, Indigenous, and people of color) regularly have shorter life spans and poorer health outcomes than their white counterparts(2). Research is illustrating that these health disparities come from the racism and discrimination experienced by these populations, rather than any genetic differences between their races(1-3). Factors such as access to health care and quality housing, poverty, education systems, and the policies that hold these barriers in place all contribute to worse health outcomes(1,4). This framing is important when considering the following data analysis, because we seek to make the connection between the experiences of discrimination and racism and higher risk for adverse health conditions and outcomes rather than to perpetuate false stereotypes about behaviors of populations.
We acknowledge the use of “whites” as the normative reference group for statistical analysis, and the role it plays in sustaining social privilege. We used “whites” as the reference group for this analysis because it was both the group with the largest numbers (n) and lowest risk of health outcomes.
- King A, Shepard K. Race is not a health risk factor. Racism is. National Public Radio. https://www.kuow.org/stories/race-is-not-a-health-risk-factor-racism-is. Published 2020. Accessed December 2, 2020.
- Robert Wood Johnson Foundation. Race, Racism and Health. https://www.rwjf.org/en/library/collections/racism-and-health.html. Accessed December 2, 2020.
- Shariff-Marco S, Breen N, Landrine H, et al. Measuring everyday racial/ethnic discrimination in health surveys: How Best to Ask the Questions, in One or Two Stages, Across Multiple Racial/Ethnic Groups? Du Bois Rev. 2011;8(1):159-177. doi:10.1017/S1742058X11000129
- Hostetter M, Klein S. In Focus: Reducing Racial Disparities in Health Care by Confronting Racism | Commonwealth Fund. https://www.commonwealthfund.org/publications/newsletter-article/2018/sep/focus-reducing-racial-disparities-health-care-confronting. Published 2018. Accessed December 2, 2020.

Compared to whites, people self-identifying in the following race/ ethnicity categories were:
American Indian/ Alaska Native Residents, Indigenous
- 2 times more likely to have COPD
- 56% more likely to be obese
- 56% more likely to experience high cholesterol
Black Residents
- 87% more likely to experience high blood pressure
- 84% less likely to receive routine dental care
- 79% more likely to have diabetes
- 28% more likely to be obese
Hispanic/ Latine
- 39% more likely to have diabetes
‘Other Race’ or Mixed Race Residents
- Residents self-identifying as ‘other’ race (for example, American Indian/ Alaska Native or Indigenous, mixed-race, etc.) were 43% more likely to have COPD
- Residents identifying as ‘mixed race’ were 2.7 times more likely to report a fall
For more information on Race/ Ethnicity in WNC, see Western North Carolina Data Story.

The items below are paraphrased themes that emerged from a 2021 regional survey of key informants. These responses do not:
- Necessarily reflect accurate or scientifically validated information about health determinants, outcomes, and/or strategies for change,
- Represent an exhaustive list of factors that can help or hurt efforts to address this key regional health issue.
The information in this section should be interpreted and used with care. It should be used only to help local health departments and agencies begin to understand community perceptions about local health issues. Communities are strongly encouraged to collect their own, local-level data to inform local planning and evaluation activities.
What’s Helping?
- Education
- Connections between healthcare providers
- Community/Family Support
- More low cost options for healthcare coming into area
- Charity programs
What’s Hurting?
- Cultural Barriers
- Distance/Transportation to care
- High cost of care (Affordable Healthcare not actually affordable)
- No specialists/Lack of providers
- Lack of education
- Poverty
- Misconception/Pride/Stigma
What are we hearing?
“Strength of our community-based services that do not take no for any answer.”
“The availability to connect people with opportunities to support whole-person health including physical, mental and community support.”
“The shift from agencies to trauma-informed work, equity focus, and the commitment to serving the whole child or whole person.”
“A growing awareness of health issues especially around access to care.”
“Emerging community conversations around diversity, equity and inclusion.”
“More of the population seems to have some sort of health insurance than years ago.”
How is the region prioritizing social determinants of health?
The western North Carolina region includes 17 communities: 16 counties and Eastern Band of Cherokee Indians (EBCI)

